Debugging Sidebar Gadgets
Apparently, you can debug JScript in Visual Studio.
The documentation for this is horrendous, though. Almost every resource talks about debugging ASP.NET programs. If you’re writing a Windows Vista Sidebar Gadget, this isn’t a lot of use.
First, you need to enable script debugging:
- In Internet Explorer, go to Tools -> Options.
- Click on the Advanced tab.
- Ensure that “Disable script debugging (Other)” is unchecked.
Then, to debug your gadget:
- Ensure that your gadget is installed on the sidebar.
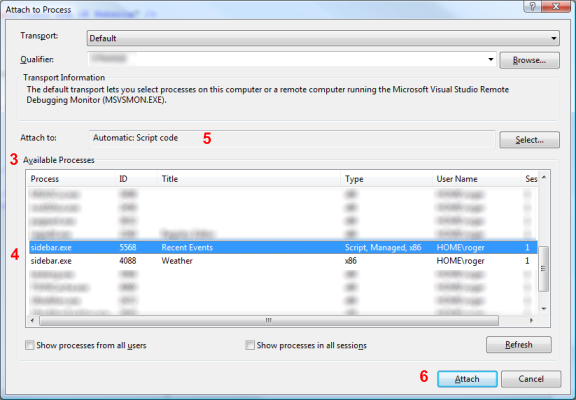
- In Visual Studio, go to Debug -> Attach to Process.
- In the Available Processes list, you’ll see one or more instances of
sidebar.exe. There’s one for each loaded gadget, with the Title column telling you which one is which. The title is taken from your Gadget XML. - Click on the one you want to debug.
- Note that the Attach to label will show you which debugger will be invoked (normally it’s the Script one).
- Click the Attach button.
Once you’ve done this, you should be able to place breakpoints in your Javascript and then step through your code.
If you want to debug your gadget’s startup code, you’ll need to do something like this:
function onLoad()
{
    debugBreak;

    // Rest of code goes here
}
When the scripting engine reaches the debugBreak; line, you’ll get a message box saying “A Runtime Error has occurred. Do you wish to Debug?”. If you click on the Yes button, you can debug using Visual Studio. Note that you’ll have to use the “Set Next Statement” command to skip over the offending statement.