Remote Debugging With Visual C++
Overview
This document contains some quick tips for getting remote debugging with Visual C++ working. The document was originally written by Roger Lipscombe to cover VC5. Rei Wilkinson reviewed it, and added some stuff for VC6 use.
Terms
- Target Machine
- This refers to the machine which will eventually run the program that you want to debug. Also called the debugee. You’ll run the debug monitor on this machine.
- Local Machine
- This refers to the machine on which you’ll run the Visual C++ debugger.
Copy the Debug Monitor Files
If the target machine doesn’t have Visual C++ installed, you’ll need to copy the files for the debug monitor to it. Put
these files in a temporary directory, for example C:\MSVCMON. The files you’ll need are:
- msvcmon.exe
- msdis100.dll (msdis110.dll for VC6)
- tln0t.dll
- dm.dll
You’ll find these files in the SharedIDE\bin directory of your Visual C++ installation. By default, this is
C:\Program Files\DevStudio\SharedIDE\bin for Visual C++ 5, and C:\Program Files\Microsoft Visual
Studio\Common\MSDev98\bin for Visual C++ 6.
- msvcp50.dll (msvcp60.dll for VC6)
- msvcrt.dll (this might already be present on the target machine)
You’ll find these files in your System32 directory. By default, this is C:\Winnt\System32. There’s no need to copy
them to the System32 directory on the target machine. Just put them in the same directory as the other files you
copied.
Start the Debug Monitor
On the target machine, start msvcmon. You’ll be presented with the following dialog:
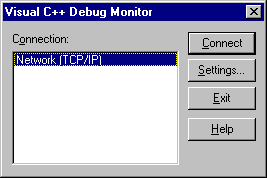
Click "Settings…". You’ll be presented with the following dialog:
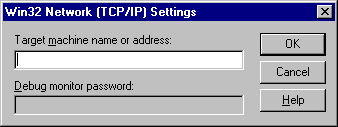
In the "Target machine" box, enter the name (or IP address) of the machine on which you will run Visual C++. You can password-protect your connection. To do this, enter a password into the "Debug monitor password" box.
Press OK to close this dialog, and then press "Connect" in the main dialog. Assuming that you’ve copied all of the necessary files and configured the debug monitor correctly, you should see the following dialog:

Press "Disconnect" to close this dialog box when you’ve finished debugging.
Configure Visual C++
In Visual C++, load the project that you want to debug, and go to Build|Debugger Remote Connection… You’ll see this dialog box:
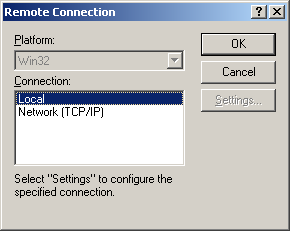
Select "Network (TCP/IP)" from the list, and click "Settings…". You should select "Local" when you have finished debugging remotely, and wish to debug a local process. You’ll see this dialog:
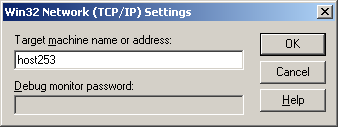
As shown here, enter the name of the target machine into the box. This is the machine that is (hopefully!) running the Debug Monitor. If you configured a password in the Debug Monitor, enter the password in the "Debug Monitor password" box.
Set up the Project Settings
| Go to Project | Settings. You’ll see the following dialog box (some of the details have been hidden): |
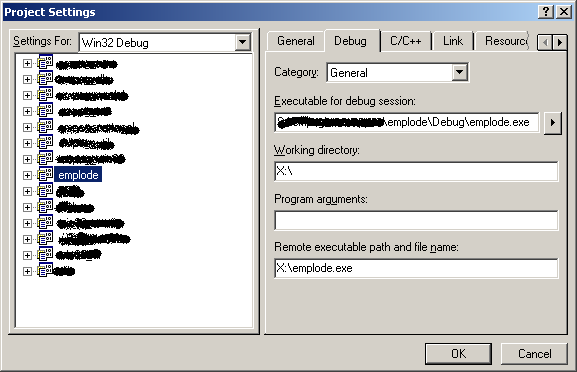
Select the project that you’d like to debug in the left-hand pane. If you were debugging a DLL, you’d specify the host executable in the dialog box. Here we’re debugging an EXE, so we just put its name in the dialog box. The settings are specified as follows:
- Executable for debug session
- This is the name of the executable that the debugger will load. This is typically the file on the local disk. However, if you have a network connection to the remote machine, you may prefer to specify the location of the file on the remote machine. However, the debugger will be much slower to start if you do this.
- Working directory
- This is the working directory from the point of view of the target machine.
- Program arguments
- Arguments to be passed to the executable.
- Remote executable path and file name
- This is the path to the executable to be debugged. This is expressed relative to the remote machine.
Additional DLLs
Let’s take a quick look at the Additional DLLs page (use the Category combo box):

You can ordinarily leave the box well alone. By default the "Modules" list will be empty. Usually, you’ll ensure that the "Try to locate other DLLs" box is checked.
It is recommended that if you’re debugging over a slow link, for example a dialup connection, then you should uncheck this box. If you don’t, you’ll be constantly prompted by the "Find Local Module" dialog box. If you need to specify additional DLLs to load, specify them manually in this list.
In this case, you can see that the project is set up for remote debugging. As the DLLs named in the "Remote Name" column are loaded, the debugger will load the symbols from the corresponding entry in the "Local Name" column. If there is no corresponding entry in the "Local Name" column, this tells the debugger to skip the symbols for the DLL in the "Remote Name" column.
This box is filled in automatically by the debugger (see the item on "Find Local Module" under "Starting the Debugger" below). Ordinarily you should never need to touch it.
Start the Debugger
Press F5.
Often, when debugging remotely, you’ll be prompted with the "Find Local Module" dialog box:
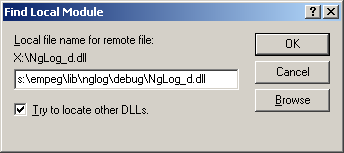
This means that the remote process has just loaded a DLL, and in order to debug it reliably, the (local) debugger needs to find the DLL in order to load its symbol table. For example, in this case, the remote process has just loaded "X:\NgLog_d.dll". You then enter the path to the local copy of this DLL. In this example, the DLL is built to "s:\empeg\lib\nglog\debug\NgLog_d.dll", so that’s what you’d enter.
If you don’t want to load the symbols for a DLL, just press Cancel. This causes the debugger to skip loading the symbols for that DLL.
The debugger will also ask you for paths to system DLLs. For example, you might be prompted for the location of
C:\WINDOWS\SYSTEM\OLEAUT32.DLL. In this case, you could enter the path to your local copy of OLEAUT32.DLL. Often,
however, the remote machine will be running a different version of Windows, for example, the remote machine is running
NT4SP3 and you’ve got SP4 installed. In this case, the DLLs won’t match, and the debugger won’t load the symbols.
Entering the path to system DLLs is only really of any use if both of the following apply:
- You’re running exactly the same version of Windows.
- You’ve got the debug symbols installed locally.
In most cases, save yourself the hassle and just press Cancel.
Troubleshooting
The ‘VC++ Debug Monitor’ is not correctly installed and running on the machine ‘debuggee’.
Check that the Debug Monitor is actually running (and waiting for a connection) on the remote machine. If it isn’t start it and try again. If it is, press "Disconnect" and confirm the target machine details. You might like to try and enter the debugging machine details as an IP address, rather than as a machine name. Try pinging the debugger from the target machine and vice versa. Do this by specifying the names and the IP addresses.
Also, try putting the IP address in the corresponding dialog box in the debugger. If you want to find out the IP address of the local machine, use the ‘ipconfig’ command.
The local executable does not match the remote one. Do you want to continue?
The executable on the local machine (specified in the "Executable for debug session" box, and the executable on the remote machine ("Remote executable path and file name") do not match. Continuing may cause difficulty in the debugger. For example, you may not be able to set breakpoints. Source code lines in the debugger may not correspond to the actual path of execution of the remote machine.
To fix this, simply ensure that the local executable is built, and copy it to the remote machine again.
Alternatively, set your Link options to output the finished executable to the location on the remote machine, so that when you build, the file is automatically updated. If you do this, you’ll have to enter the location of the remote file in both of the boxes in the Debug settings.
Debugging COM DLLs is not working
Ensure that you’ve built the version of the source code on the local machine, and copied the output files to the remote machine. Also, ensure that you’ve registered (on the remote machine) the DLLs from this location.
I accidentally pressed Cancel to the "Find Local Module" dialog box, and now the debugger won’t load the symbols for a DLL.
Go to the Additional DLLs section (as shown above), and check the list box.
If the offending DLL is listed without a corresponding local DLL, then the debugger will not load the symbols. To fix this, delete the DLL from the list box. The next time you start the debugging session, the debugger will prompt you again for the location of the DLL.
If the DLL is listed with a local DLL, then the DLLs are out of sync. If this is a system DLL, you’re stuck - the remote machine must be running a differerent version of Windows. If this is one of your DLLs, ensure that the local and remote copies are in sync.