VictoriaMetrics static scraper
I’ve got an Electric Imp Environment Tail in my office. It monitors the temperature, humidity and pressure. Currently, to display a graph, it’s using flot.js and some shonky Javascript that I wrote. It remembers samples from the last 48 hours.
Rather than write more shonky Javascript, or post it to a third-party metrics service, I’m just going to add it to my cluster’s VictoriaMetrics+Grafana setup.
Exposing Metrics
The first thing to do is to expose the most-recent readings in Prometheus-compatible format. I’ve updated the agent source code to include the following:
app.get("/metrics", function(context) {
    // Unix epoch, seconds.
    local t = time();
    // Multiplying by 1000 overflows, so just jam some zeroes on the end in the string format.
    context.send(200, format("temperature %f %d000\nhumidity %f %d000\npressure %f %d000\n",
        LATEST.tempHumid.temperature, t,
        LATEST.tempHumid.humidity, t,
        LATEST.pressure.pressure, t));
});
Scraping metrics
To scrape those metrics, we need a VMStaticScrape resource:
apiVersion: operator.victoriametrics.com/v1beta1
kind: VMStaticScrape
metadata:
  name: imp-environment-tail
  namespace: monitoring-system
spec:
  jobName: "imp-environment-tail-office"
  targetEndpoints:
    - targets: ["agent.electricimp.com"]
      labels:
        env: office
      scheme: "https"
      path: "/agent-id-goes-here/metrics"
The annoying part here is that it won’t take a URL; you need to specify the scheme and path separately from the
targets.
The labels are to make it easier to find later in Grafana.
VMAgent
To actually run the scraper, we need a VMAgent resource:
apiVersion: operator.victoriametrics.com/v1beta1
kind: VMAgent
metadata:
  name: agent
  namespace: monitoring-system
spec:
  staticScrapeSelector: {}
  staticScrapeNamespaceSelector: {}
  remoteWrite:
    - url: "http://vmsingle-vm-database.monitoring-system.svc.cluster.local:8429/api/v1/write"
Note the <service>.<namespace>.svc.cluster.local bit. I think the selectors are required as well, otherwise it
doesn’t bother scraping anything.
Agent status
You can check the status of the VM agent with the following command and a browser:
kubectl --namespace monitoring-system port-forward \
--address 0.0.0.0 \
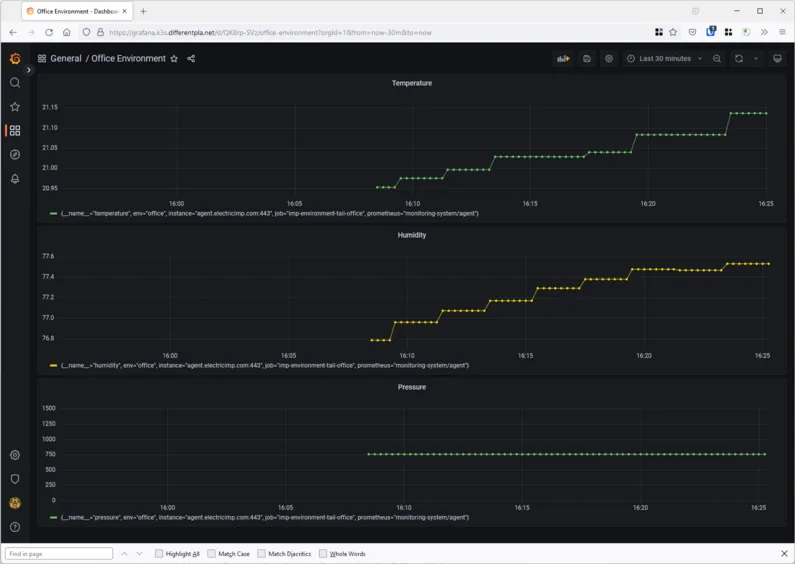
service/vmagent-agent 8429:8429Grafana
Once that was all working, I quickly cobbled together a dashboard: