VictoriaMetrics
The documentation for VictoriaMetrics is a bit of a mess, so here’s what worked for me.
Install the Kubernetes Operator
A Kubernetes Operator (usually):
- Adds a bunch of Kubernetes CRDs, so that you can define resources in YAML.
- Adds a controller that monitors those CRDs and either translates them into standard Kubernetes resources or applies them directly.
From https://docs.victoriametrics.com/operator/quick-start.html:
VM_VERSION=`basename $(curl -fs -o/dev/null -w %{redirect_url} https://github.com/VictoriaMetrics/operator/releases/latest)`
wget https://github.com/VictoriaMetrics/operator/releases/download/$VM_VERSION/bundle_crd.zip
unzip bundle_crd.zip
kubectl apply -f release/crds
kubectl apply -f release/operator% kubectl --namespace monitoring-system get all
NAME READY STATUS RESTARTS AGE
pod/vm-operator-55f666998d-rgn5v 1/1 Running 0 6m11s
NAME READY UP-TO-DATE AVAILABLE AGE
deployment.apps/vm-operator 1/1 1 1 6m11s
NAME DESIRED CURRENT READY AGE
replicaset.apps/vm-operator-55f666998d 1 1 1 6m11sDefine a VMSingle
apiVersion: operator.victoriametrics.com/v1beta1
kind: VMSingle
metadata:
  name: vm-database
  namespace: monitoring-system
…causes the operator to create a bunch of other stuff. It gives us a deployment, a replicaset, a service and a pod:
% kubectl --namespace monitoring-system get all
NAME                                        READY   STATUS              RESTARTS   AGE
pod/vm-operator-55f666998d-rgn5v            1/1     Running             0          6m11s
pod/vmsingle-vm-database-8447df86cc-xgt55   0/1     ContainerCreating   0          15s

NAME                           TYPE        CLUSTER-IP     EXTERNAL-IP   PORT(S)    AGE
service/vmsingle-vm-database   ClusterIP   10.43.31.176   <none>        8429/TCP   15s

NAME                                   READY   UP-TO-DATE   AVAILABLE   AGE
deployment.apps/vm-operator            1/1     1            1           6m11s
deployment.apps/vmsingle-vm-database   0/1     1            0           15s

NAME                                              DESIRED   CURRENT   READY   AGE
replicaset.apps/vm-operator-55f666998d            1         1         1       6m11s
replicaset.apps/vmsingle-vm-database-8447df86cc   1         1         0       15s
The pod crashes. Let’s look:
kubectl --namespace monitoring-system describe pod vmsingle-vm-database-8447df86cc-xgt55

...
  Warning  Unhealthy  66s (x9 over 111s)  kubelet            Readiness probe failed: Get "http://10.42.4.92:8429/health": dial tcp 10.42.4.92:8429: connect: connection refused
  Warning  BackOff    52s (x5 over 85s)   kubelet            Back-off restarting failed container
  Normal   Pulled     38s (x3 over 86s)   kubelet            Container image "victoriametrics/victoria-metrics:v1.79.2" already present on machine
kubectl --namespace monitoring-system logs vmsingle-vm-database-8447df86cc-xgt55
invalid value "" for flag -retentionPeriod: duration cannot be emptyThe VM docs are a bit of a mishmash, but it’s a number followed by a unit, e.g. 52w. The default is months, but you
still need a number. If you specify 3m, it fails because it’s ambiguous (months vs. minutes), so I guess if you want 3
months, either omit the suffix, or use 12w or 90d or something:
apiVersion: operator.victoriametrics.com/v1beta1
kind: VMSingle
metadata:
  name: vm-database
  namespace: monitoring-system
spec:
  retentionPeriod: 12w
We need some persistent storage, so let’s add that:
apiVersion: operator.victoriametrics.com/v1beta1
kind: VMSingle
metadata:
  name: vm-database
  namespace: monitoring-system
spec:
  retentionPeriod: 12w
  storage:
    accessModes:
      - ReadWriteOnce
    resources:
      requests:
        storage: 1Gi
    storageClassName: longhorn
It exposes a ClusterIP service; let’s wire something up to it and see what’s there:
kubectl --namespace monitoring-system port-forward --address 0.0.0.0 service/vmsingle-vm-database 8429:8429That returns a simple home page with various links on it.
Adding it to Grafana
In Grafana, go to Configuration / Data Sources and add a Prometheus data source.
The vmsingle-vm-database service is a ClusterIP, so it’s available at <service>.<namespace>.svc.cluster.local. The
Prometheus URL is therefore http://vmsingle-vm-database.monitoring-system.svc.cluster.local:8429.
I left everything else as the defaults, and the Save & test button worked, which was encouraging.
Initially, there’s no data. The Grafana metrics browser doesn’t have anything to auto-complete. VictoriaMetrics isn’t
exporting any metrics. You can see this by going to http://localhost:8429/api/v1/labels (using the port-forward from
earlier).
VictoriaMetrics reports metrics (at http://localhost:8429/metrics), in Prometheus format, but they’re not scraped by
default. To turn on self-scraping, we need to update the VMSingle some more:
apiVersion: operator.victoriametrics.com/v1beta1
kind: VMSingle
metadata:
name: vm-database
namespace: monitoring-system
spec:
retentionPeriod: 90d
extraArgs:
selfScrapeInterval: 10s
storage:
accessModes:
- ReadWriteOnce
resources:
requests:
storage: 1Gi
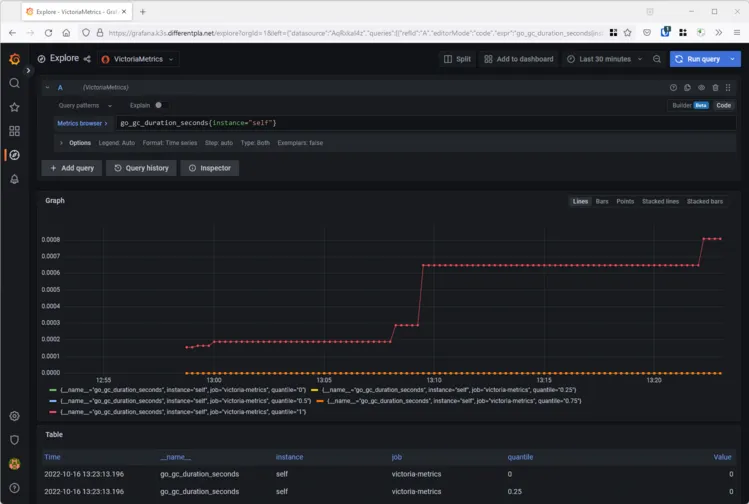
storageClassName: longhornAt this point, Grafana’s metrics browser starts working, and we can use Explore to see some metrics.